
Introduction to Power BI VS Zoho Analytics
Data Analysts make good and wise decisions in collecting and analyzing critical data points to make business decisions. Power BI and Zoha Analytics are very well-known Business tools. We can use both of these tools to analyze the data to develop a suitable product. These two provide good security features for the user. But which is the best tool? Power BI or Zoho Analytics? You can learn and explore power BI using power bi training. So, Let us Compare Power BI and Zoho Analytics and find out the best tool among them.
What is Power BI?
Power BI is a collection of services, apps, connectors that work together to turn unrelated data sources into visually immersive, coherent, and interactive sights. It provides a free version of the above platform with a 1 GB data capacity limit per each user, and also it provides a data refresh schedule once per day. It can be presented from Google Analytics, Salesforce, and other platforms on desktops and mobile devices.
What is Zoho Analytics?
Zoho Analytics is a self-service business intelligence and analysis platform that helps to quickly analyze the business data and create reports on that basis and make dashboards for informed decision making. It easily creates and shares powerful reports in minutes with no IT help. It is an excellent tool for the analysis of data and also knowledge maintenance. With the use of this tool, we can get reports in graphs, tables, maps, and many more.
Features of Power BI
Attractive Visualizations:
The data representation in a visual manner plays a vital role in it. Power BI provides a large variety of visualizations. Here, we can create dashboards reports and use complex or straightforward visualizations on the basis of your dataset. Also, it provides custom visualization.
Data Source:
Data Source helps its users to use data from a big range in the sources of data. The sources of data present in any place in the spectra from unstructured manner to structured manner, and many more. Data Sources include Power BI datasets, SQL server, MySQL database, Azure, Oracle, etc.
Filtering Datasets:
A collection of data is called a Dataset and that is taken from a different maximum number of data sources. Datasets are used to create different kinds of visualizations. Here, We can take the datasets which are filtered and have the data that contain only the critical and appropriate for certain circumstances.
Reports having Information:
Reports that are present in the Power BI are a set of dashboards that have different types of visualizations that are important to a specific topic.
Customizable Dashboards:
Dashboard is a set of visualizations which gives perfect data or some insights into the data. Specific dashboards present in the Power BI are derived into some parts called tiles. These reports will be present in a single page.
Flexible Tiles:
A tile is a single block that contains a visualization in a Power BI dashboard. These tiles can be used for a clearer view. These tiles can be adjusted and also can be changed.
Navigation Pane:
The navigation pane has options of datasets, dashboards, and some specific reports. Users can freely work in the Power BI and navigate between datasets, dashboards, and messages they are creating.
Features of Zoho Analytics
Data Integration:
Initially, data must be appropriately analyzed. The data should be taken from 250+ data sources. It connects to web URLs, data from the files, databases, business apps, etc.
Data Preparation and Management:
We should use our self-service data preparation and management app within Zoho Analytics. You ensure that your raw data is cleansed, transformed, and enriched for better and a simple analysis.
Visual Analysis:
Here, Analyze the given data and use various visualization tools to make a good and a clear vision.
Security and Governance:
Zoho Analytics is governed by strong Zoho practices, including some support for redundancy, backup, confidentiality, and privacy to make sure that the data is safe and secure.
Mobility:
Mobility is the accessing and interacting with the given data, reports, and dashboards from mobile phones and tablets.
Deployment:
According to user needs, initially subscribe to Zoho Analytics cloud, or install it on-premise in our own servers. Or deploy everything in the shadows like AWS, Azure, Google.
Embedded BI:
Embedded BI offers a white-labeled BI and analytics app under the brand name. Set up an analytics portal or embedded within the app.
Power BI vs Zoho Analytics Comparison
Analyzing Data :
Power BI gives a large set of analyzing capacities to the starters and also the end users and it offers several functionalities. Here, we have to prepare the information within a tool on the desktop, and also we should publish it using the web tools. Customers believe that they require a computer which has a high capacity of RAM to use the desktop tool, also that system may lag whenever you are working with the larger datasets. Zoho Analytics is a typical approach as compared to the Power BI, in the presence of a system that offers automatic generation. The software in it also suggests the kind of reports that you tried to create using the provided data that you gave input to the system.
Data Visualizations:
Power BI is very well known for making the best in class data visualizations other than any software. Power BI gives an undefined number of excellent visualizations and different customization options. Many galleries have great visualizations of already made data, which are created by some users that can be an advantage until we follow all the rules of the community. Zoho Analytics automatically generates visualizations and also gives us the chance to modify those designs in the future via text formatted boxes, resizing, etc. We could show the similar data which is the same in various multiple visualizations of data if we wanted to. Users can easily choose various other kinds of works to maintain the excellent presence with the dashboard.
Leaders:
Power BI converts data into rich interactive visualizations, which utilizes business analytics tools to share dashboards to all devices. Zoho Analytics is a self-service BI and an excellent analytics platform that helps users to get new insights from their business data.
Integrations:
Since we know that Power BI works excellent with Microsoft products, and it also integrates with some other software (not Microsoft), including SAP and Google Analytics. Zoho Analytics offers many more integrations than Power BI, and it uses more than 500 out-of-box integrations.
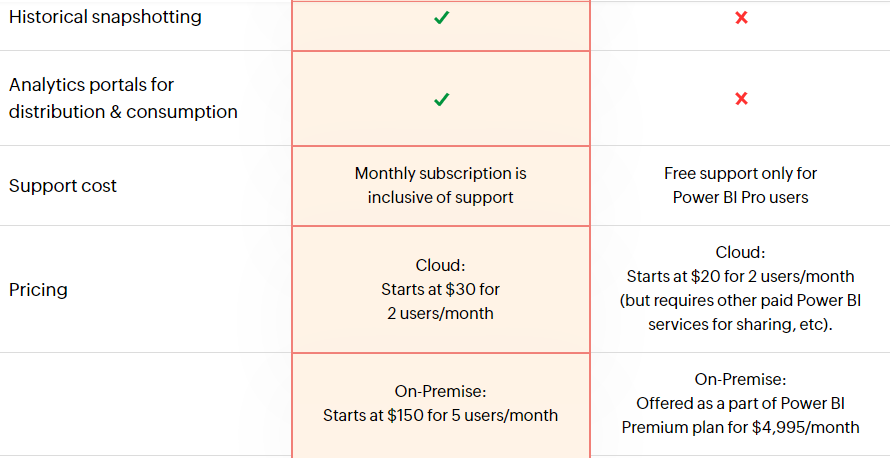
Cost:
Power BI starts with a basic $9.99 per month for every user and a premium plan of $20 per month for every customer. Zoho Analytics starts with a goal of $24 for every user per two months. In comparison, Power BI is better than Zoho Analytics.
Security Provided:
The data in the digital format must be protected because it is important in the today business world. The security of the given data capabilities provided by the Power BI include labeling everything in a sensitive manner and also real-time accessing. It offers a set of different permissions with different security levels. Zoho Analytics provides two way authentication and some important enterprise-grade features of security. Here, the things are easy to track everything and can be done in an easier way to give a report restriction if needed.
User Friendly:
Since we know that Power BI was developed for Microsoft Products, it helps that the software is relatively familiar with some other Microsoft offerings. It provides a good amount of user-friendliness given to its data analysis capabilities. It also provides an online community that provides help to the users. Zoho Analytics is made for beginner-level employees to make data analytics. It does not require a long period of training to get started and also offers specific functionalities for more advanced users using some customized SQL queries. In comparison, we can say that Power BI is more user-friendly than Zoho Analytics.
Read This comparison PDF
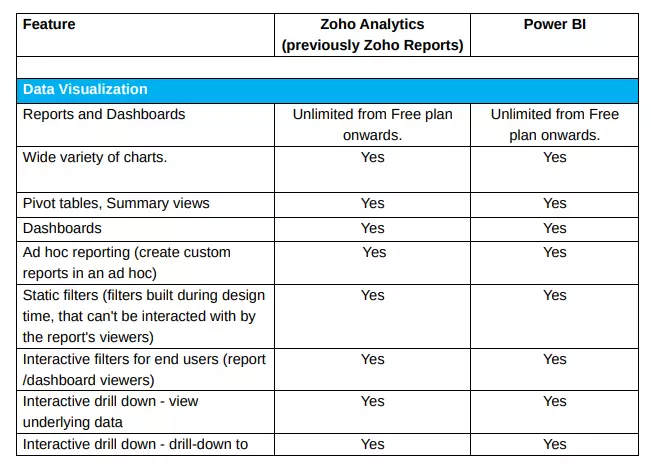
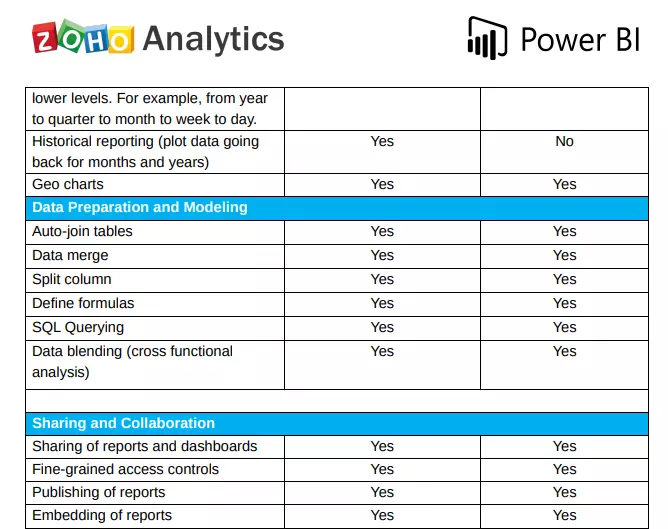
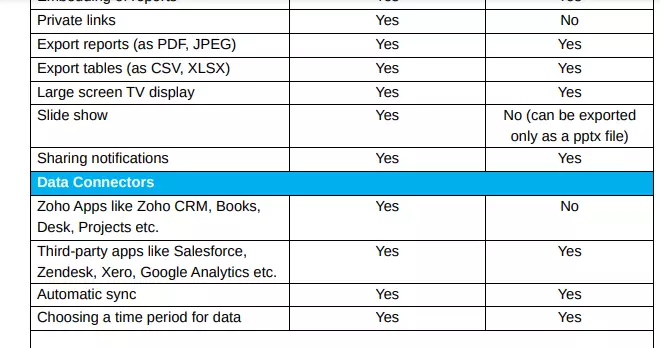
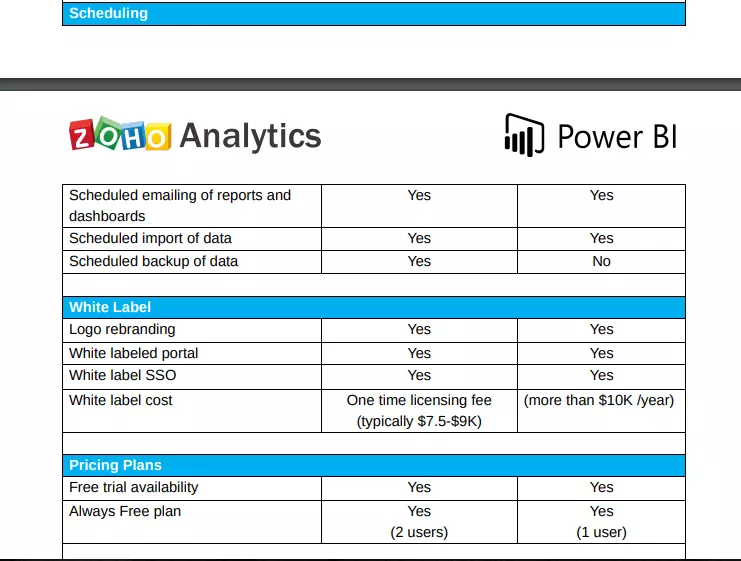
Source: wedelroos
Which one should we select?
Both of them are very useful to the users. Power BI is an excellent tool for the users who work with large datasets and also want customized data visualizations, and also those who already use Microsoft softwares. Zoho Analytics is very good for freshers and intermediate users who do not need many customizations and advantages from the automated works and also anyone who is already a user of Zoho software.
Coming to the cost, Power BI starts a basic plan at $9.99 per 1 month for every user and a premium plan at $20 per 1 month to every customer. At the same time, Zoho Analytics takes $24 per 1 month but for two users. There is a slight difference they are providing with good features. You can choose anyone from this.
Source: zoho
Feature Rating Comparison
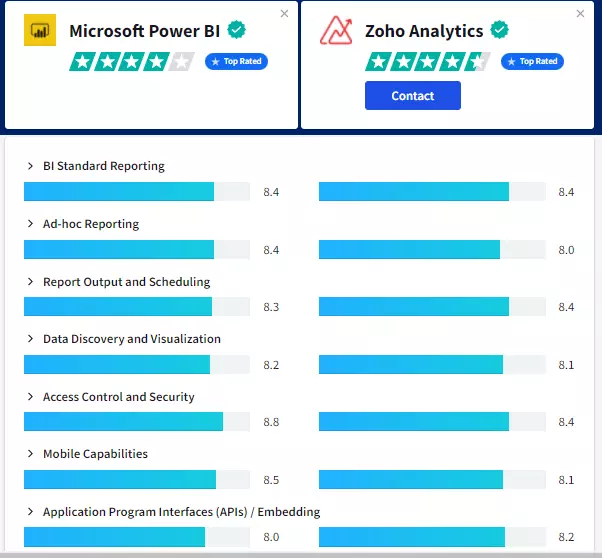
Source: trustradius
Conclusion
In this article, we have seen Power BI and Zoho Analytics. Also, we have seen the features of Power BI and Zoho Analytics. The comparison of Power BI and Zoho Analytics and which one we should choose are also seen. In contrast, Power BI is far better than Zoho Analytics. It helps to work together with the unrelated sources of some interactive sights. It offers a 1 GB capacity of storage in the basic plan.
Read: Zoho vs Hubspot vs CircleOne CRM: Features & Pricing Comparison