
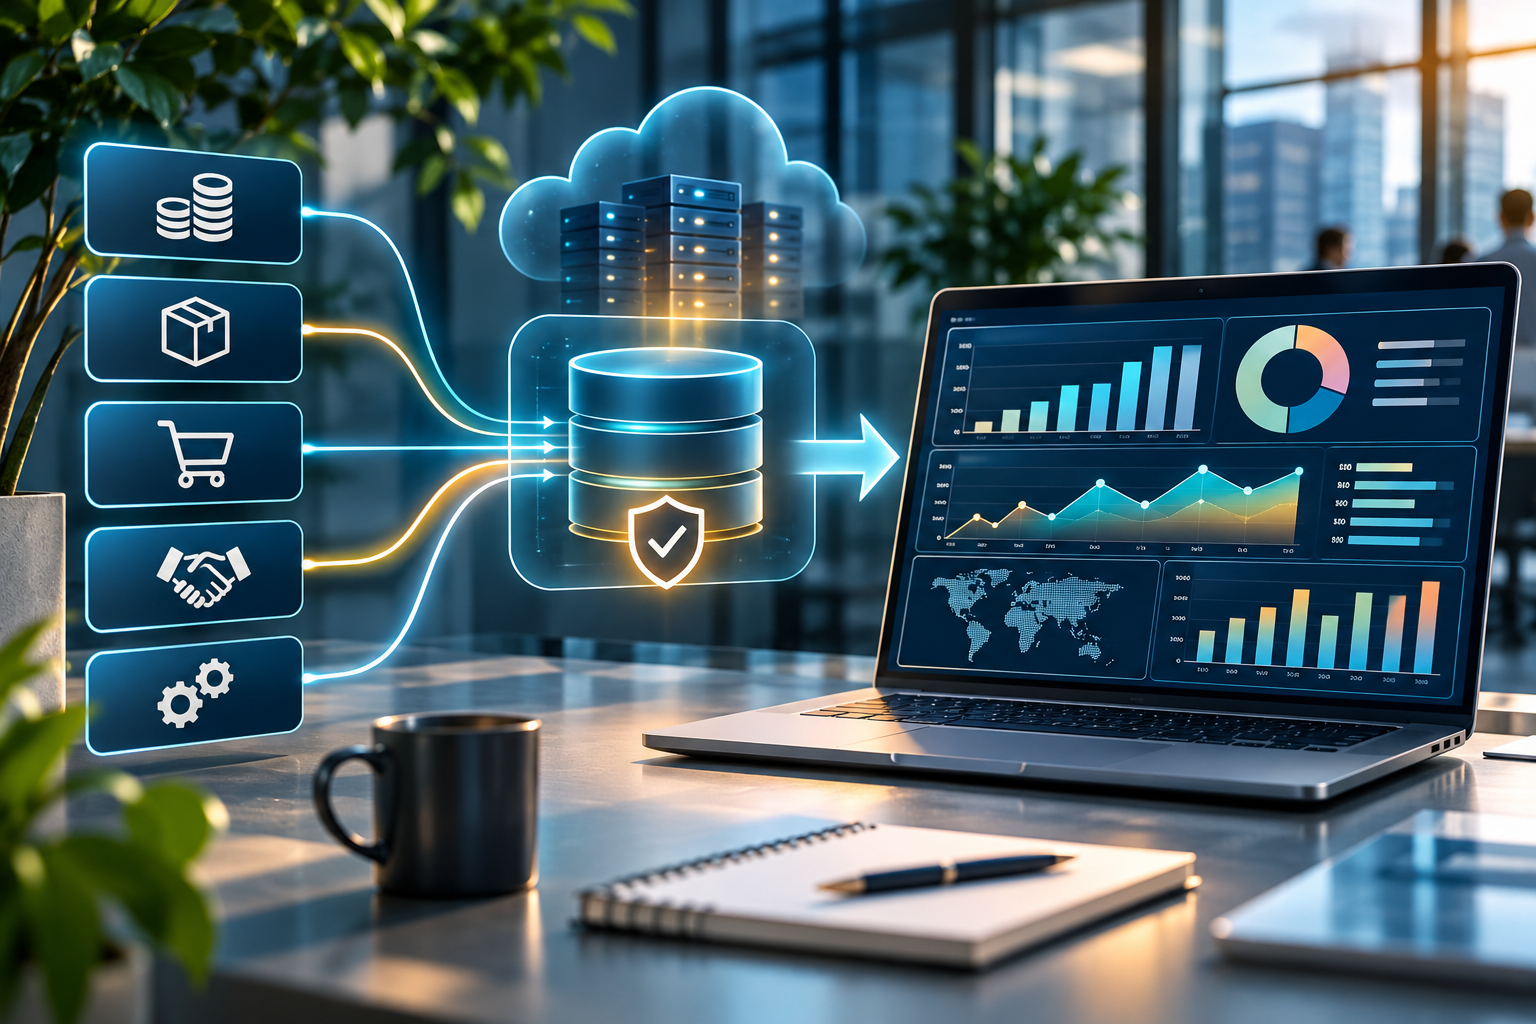
ERP platforms record the transactions that run a business: orders, purchasing, inventory, production, projects, finance and fulfilment. Turning those records into reliable decisions requires more than a dashboard. It requires a data architecture that can extract information from ERP and adjacent systems, preserve business definitions, manage data quality and make trusted metrics available to the right people.
This guide compares data and analytics platforms that can support ERP reporting and broader enterprise analysis. It separates analytics and data-engineering platforms from visualisation tools because they solve related, but different, problems. Product capabilities and licensing change; treat this as a shortlist for structured evaluation rather than a universal ranking.
What ERP data analytics needs to solve
- Operational visibility: inventory availability, order status, production throughput, procurement cycle time and service levels.
- Financial control: margin, working capital, cash flow, cost centre performance and consolidated reporting.
- Cross-system analysis: combine ERP transactions with CRM, ecommerce, warehouse, logistics, HR and external data.
- Trusted definitions: standardise measures such as revenue, gross margin, on-time delivery and inventory turns.
- Governance: enforce access controls, lineage, retention, auditability and appropriate handling of sensitive data.
ERP data analytics tools compared
1. Microsoft Fabric and Power BI
Microsoft Fabric brings data engineering, Data Factory, data science, real-time intelligence, warehousing and reporting into a SaaS analytics environment. OneLake provides a shared logical data lake, while Power BI provides semantic models, reports and dashboards. This combination is relevant when ERP data already sits in Microsoft Dynamics 365, Business Central, SQL Server or Azure, although connectors, capacity, data movement and licensing still need to be assessed.
Consider it when: the organisation wants an integrated Microsoft analytics stack and can govern Fabric capacity, workspaces, semantic models and access.
Check before selection: Fabric capacity sizing, refresh frequency, gateway requirements, data residency, licensing and whether ERP data needs transformation before reporting.
2. Tableau
Tableau is a visual analytics platform used to explore data and communicate findings through interactive dashboards. It can connect to ERP extracts, databases, cloud warehouses and other enterprise sources. It is often shortlisted where analyst-led exploration, visual flexibility and broad dashboard consumption are important.
Consider it when: teams need rich visual exploration across several business systems and have the data modelling and governance practices to support consistent metrics.
Check before selection: data preparation responsibilities, extract versus live-query design, permissions, content governance and the total cost of creators, explorers and viewers.
3. Qlik Cloud Analytics
Qlik Cloud Analytics combines data visualisation and associative exploration. Its approach can help analysts investigate relationships across operational data rather than following only predefined dashboard paths. Qlik also offers data integration capabilities, which may be relevant where ERP information must be moved and prepared before analysis.
Consider it when: analysts need flexible discovery across complex datasets and the organisation values a broader analytics and data-integration portfolio.
Check before selection: connector coverage for the exact ERP version, data movement architecture, governance, capacity and the skills needed to build and maintain applications.
4. SAP Analytics Cloud
SAP Analytics Cloud combines business intelligence, planning and predictive analytics in a cloud service. It is a natural candidate for organisations with SAP applications and planning processes, but buyers should validate how non-SAP ERP and operational data will be integrated and governed.
Consider it when: SAP reporting and enterprise planning are central requirements and teams want analytics close to the SAP application landscape.
Check before selection: live versus acquired data patterns, supported source connections, planning requirements, licensing and the role of SAP Datasphere or other data services.
5. Databricks
Databricks is a data and AI platform rather than a conventional dashboard-first BI product. It supports data engineering, lakehouse workloads, analytics and machine learning. ERP data can be landed and transformed alongside other enterprise datasets, with downstream consumption through SQL tools and BI platforms.
Consider it when: the organisation needs a governed data foundation for large-scale transformation, advanced analytics, machine learning or multiple downstream use cases.
Check before selection: engineering skills, platform operations, data quality controls, workload cost management and the separate BI experience business users will consume.
6. Snowflake
Snowflake provides a cloud data platform for storing, processing and sharing data. It can act as a central analytical store for ERP and non-ERP information, with dashboards and analytics delivered through connected BI tools or native capabilities. It is not a replacement for the ERP application or, by itself, a complete business reporting operating model.
Consider it when: teams need a managed cloud data platform for consolidated enterprise analytics and already have, or plan to build, a data engineering and BI layer.
Check before selection: ingestion and transformation costs, warehouse sizing and auto-suspend policies, data sharing, governance, region availability and the cost of moving data out to other services.
7. Google BigQuery
BigQuery is Google Cloud’s managed analytics data warehouse. It can store and query consolidated ERP data at scale and connect to reporting tools such as Looker and other BI products. The quality of the outcome depends on the ingestion design, transformation logic, data modelling and controls built around the warehouse.
Consider it when: the business uses Google Cloud or wants a managed analytical warehouse for large datasets and SQL-based analysis.
Check before selection: query and storage cost controls, data transfer, ERP extraction patterns, access governance and how business metrics will be modelled and certified.
8. Oracle Analytics Cloud
Oracle Analytics Cloud provides analytics and visualisation capabilities for organisations working with Oracle applications and data, while also supporting broader enterprise analytics use cases. Buyers should evaluate the exact source systems and data connectivity needed rather than assuming that an Oracle ERP environment removes integration work.
Consider it when: Oracle is a significant part of the application estate and the organisation wants analytics aligned with its Oracle data and cloud strategy.
Check before selection: supported ERP data sources, semantic modelling, identity integration, deployment and licensing requirements.
Comparison: which type of platform do you need?
| Platform | Primary role | Potential ERP analytics fit | Key evaluation point |
|---|---|---|---|
| Microsoft Fabric / Power BI | Integrated data platform and BI | Microsoft-centric ERP and mixed data estates | Capacity, semantic models and governance |
| Tableau | Visual analytics | Cross-system dashboards and analyst exploration | Data preparation and metric consistency |
| Qlik Cloud Analytics | Associative analytics and data integration | Complex operational data exploration | Connectors, data movement and governance |
| SAP Analytics Cloud | BI and planning | SAP-led reporting and planning | Non-SAP integration and data models |
| Databricks | Data engineering and AI platform | Large-scale transformation and advanced analytics | Engineering skills and workload cost |
| Snowflake | Cloud data platform | Central analytical store for ERP data | Ingestion, compute and data egress costs |
| Google BigQuery | Cloud data warehouse | SQL analytics on consolidated ERP data | Query cost and data pipeline design |
| Oracle Analytics Cloud | Enterprise analytics | Oracle-heavy application environments | Source connectivity and licensing |
How to connect ERP data to an analytics platform
- Map the source landscape. Document ERP modules, versions, databases, APIs, CRM, ecommerce, warehouse and external data sources.
- Choose the extraction pattern. Evaluate vendor APIs, supported connectors, change data capture, scheduled exports and replication. Avoid direct production database access unless the ERP vendor explicitly supports the pattern.
- Define a common data model. Align customer, product, supplier, location, chart of accounts, fiscal calendar and transaction identifiers across systems.
- Build quality checks. Reconcile record counts and financial totals, detect missing keys and late-arriving records, and document transformation logic.
- Publish governed metrics. Establish certified definitions for revenue, margin, inventory turns, forecast accuracy and operational KPIs.
- Secure access end to end. Apply least privilege, row-level controls where required, audit logging, retention and data classification.
- Monitor reliability and cost. Track refresh failures, latency, query performance, storage, compute and ownership of pipeline incidents.
ERP analytics use cases and KPIs
| Function | Example KPIs | Decision supported |
|---|---|---|
| Finance | Gross margin, DSO, cash conversion, close cycle | Cash and profitability management |
| Inventory | Inventory turns, days on hand, stock-outs, ageing | Replenishment and working capital |
| Procurement | Supplier lead time, purchase price variance, on-time delivery | Supplier and sourcing decisions |
| Manufacturing | Yield, scrap, OEE, schedule adherence | Capacity and production improvement |
| Sales and fulfilment | Order cycle time, fill rate, on-time-in-full | Customer service and delivery reliability |
How to calculate the total cost of ownership
Do not compare platform subscription prices alone. Include data ingestion and integration, storage and compute, transformation, BI authoring and viewer licences, implementation, security and governance, training, support, internal engineering time and ongoing optimisation. For consumption-based services, model realistic data volumes, refresh frequency, query patterns and peak workloads. Ask vendors to demonstrate costs using your own expected workload.
Questions to ask vendors during evaluation
- Which connectors support our exact ERP product, edition and version?
- Can the platform support incremental updates without placing unacceptable load on production ERP?
- How are data lineage, metric definitions, access policies and audit events managed?
- Can finance users reconcile analytics outputs to ERP ledgers and source transactions?
- What happens when a pipeline fails, source schema changes or data arrives late?
- What are the expected costs at our forecast data volume and user count?
- Can we export data and models if we change platforms?
Final recommendation
Choose the platform based on the role it must play. A BI tool such as Power BI, Tableau, Qlik or SAP Analytics Cloud can serve dashboards and business analysis. A data platform such as Databricks, Snowflake or BigQuery can provide the engineering and storage foundation behind those experiences. Some vendors span both layers, but the responsibilities still need to be designed and costed.
For an ERP-led organisation, start with three practical tests: reconcile a finance report to the ERP ledger, trace an inventory KPI back to source transactions, and demonstrate secure cross-functional reporting. If the shortlist cannot pass those tests with transparent operating costs, it is not ready for procurement.
